Hotel development activity correlates directly with the ebbs and flows of hotel-sector performance. As we reached the peak of the current cycle in 2016, developers pursued hotel construction and redevelopment at a pace we haven’t seen since 2006 and 2007. HVS has tracked Hotel Development Costs for the last three decades, collecting data from actual hotel cost budgets during our assignments. This year’s sample reflects the largest sample HVS has analyzed given the number of hotels in the pipeline, as well as our growing presence in 35 U.S. markets. The data in this survey reflect budgets from 2016. With the availability of more data, we elected to add a lifestyle/soft-brand category and a dual-branded category; moreover, we bifurcated the extended-stay hotel category into midscale and upscale segments. These products represent some the fastest-growing sectors. Thus, our data now reflect nine product categories. The brands represented in each of our categories (in our survey data) can be found in the addenda to this study.
In the last year since the 2015/16 study was released, the most common question posed to our authors addressed the delineation of geographic data by segment. While we can sort the data for smaller samples in specific markets, we are unable to provide meaningful conclusions because of the limitations in the data set. However, the analysis and inclusion of both the median and the mean help to balance the high- and low-cost markets.
Our goal in sharing this publication is to provide a basis for developers and consultants in evaluating their hotel development projects. This report should not be relied upon to determine the cost for actual hotel projects or for valuation purposes, but rather, it is intended to provide support for preliminary estimates or support for actual cost estimates, as well as to show a comparison across the categories. Please continue to reach out to us with your comments and questions, as this feedback helps improve our annual survey.
Hotel Development on the Rise
In most U.S. markets, hotel occupancy and average daily rate (ADR) continued to rise in 2016. Hotel development in some markets was previously hindered by the lack of available brands; however, options for development have expanded as many new brands, some affiliated with the most dominant companies, have emerged. Shrinking AOPs (Areas of Protection for franchisees) and the push toward independent lifestyle hotels and soft brands has further widened the opportunities for new entries into the market.
Following six years of consecutive occupancy growth, analysts agree that we have reached the top of the cycle in terms of hotel performance, as occupancy has peaked, and ADR increases have moderated to inflationary levels. While the number of rooms available in the U.S. increased by 4.7% from 2011 through 2016, overall rooms sold grew by approximately 19.0%, resulting in rising hotel occupancy and ADR levels that support the cost of new development.
Exhibit 1: U.S. Occupancy and Average Rate
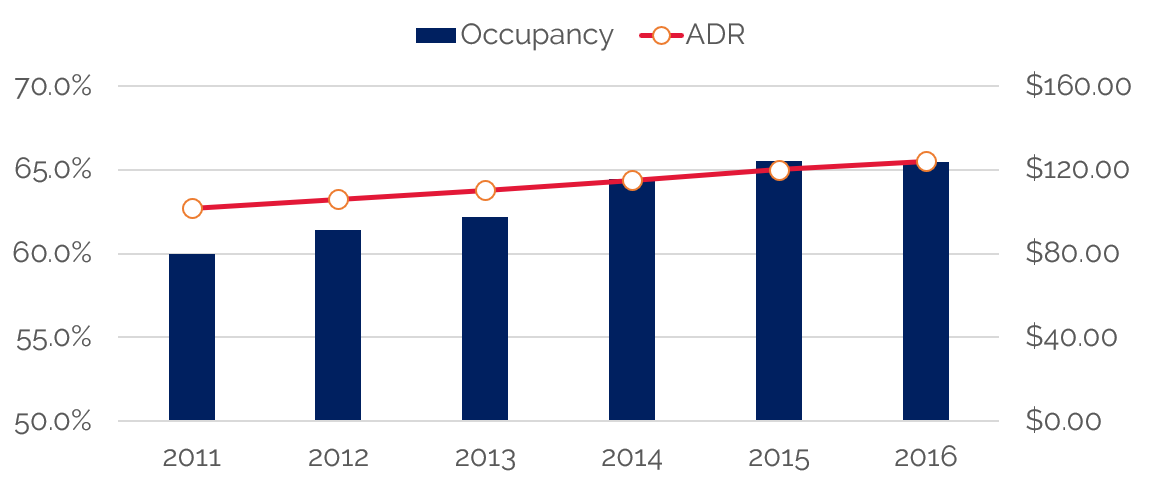
Source: STR
As evidenced in the following chart, supply growth began to surpass demand growth in 2016. With more options than ever before, hotel developers have been capitalizing on favorable market conditions. The new supply pipeline is beginning to make up for a relatively long period of modest supply growth. Some markets, including Miami, Nashville, New York City, and Seattle, are anticipated to record more than a 25% increase in hotel room supply over the next three years, with Nashville leading the way with over a 30% expected increase in supply.
Exhibit 2: U.S. Change in Supply and Demand
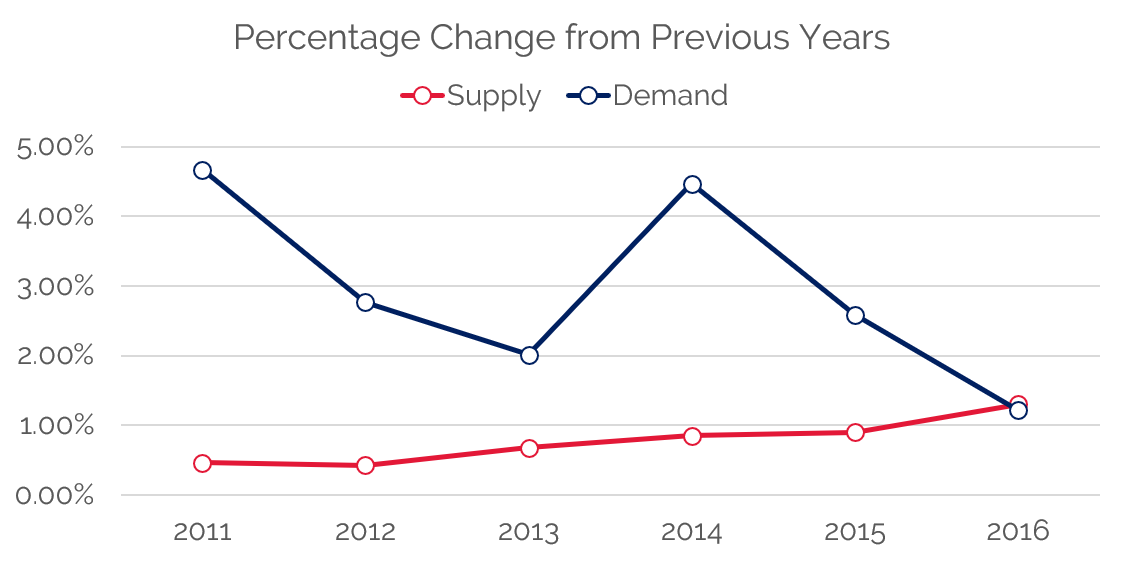
Source: STR
The major indicators of hotel performance illustrate signs of slowing growth, as presented above. Average rates in the U.S. increased slightly in 2016, while occupancy remained flat. This trend correlates to the changes in supply and demand shown in Exhibit 2, with supply growth meeting demand growth in 2016.
Macro Environment
Rising development and construction costs continue to be a major factor in new construction. While nationwide construction costs were reported to be around 4.7% higher in 2016 than in 2015 by the U.S. Department of Labor, many markets continue to experience double-digit increases in hotel construction costs. The primary factor in these rising costs is the shortage of skilled labor in major markets. The high construction volume across all market segments has caused demand for these skilled workers to surge. According to the Bureau of Labor Statistics, unemployment in the construction sector fell to 6.3% in 2016, the lowest rate registered in the last ten years. It was reported that the respective unemployment rate could have been lower, but training in this sector lags the demand for skilled laborers. The construction workforce is still 9% below its peak of 7.5 million workers in 2007 (compared to the 12% deficit last year); thus, the labor shortage is driving up construction wages, which rose 2.15% on average in 2016.
Conversely, a new trend is beginning to emerge in hotel development: modular construction. Primarily used in residential housing, modular construction is making its way into the commercial sector. While modular construction is not necessarily a cost-saving initiative from a labor and materials standpoint, the cost savings result from the shortened project timeline. Modular hotel projects save approximately two to three months in total construction time, which can be as much as a 10–15% time savings. Modular construction has additional benefits, including waste, labor, and theft reduction, as well as the ability to serve remote areas. These units are also reported to have higher quality construction given that the modular units need to withstand travel to the worksite. While none of the budgets in our survey reflected modular construction, we expect this trend to increase going forward.
Hotel Development Cost Categories
The Uniform System of Accounts for the Lodging Industry (USALI) provides industry participants with a common language for analyzing the financial performance of a hotel. However, no such system exists for hotel development budgets. Evaluating the completeness of a budget is often challenging, as different line items are used, and some components are unintentionally omitted. Based on our experience preparing the annual HVS Hotel Development Cost Survey, we have developed the following summary format for hotel development budgets, which forms the basis for the presented cost categories. We find that these categories are meaningful for hotel professionals when undertaking an analysis relating to hotel feasibility, and they provide a basis from which to analyze proposed projects.
The following illustration shows the five categories defined by HVS and the typical items that each include.
Exhibit 3: HVS Hotel Development Cost Categories
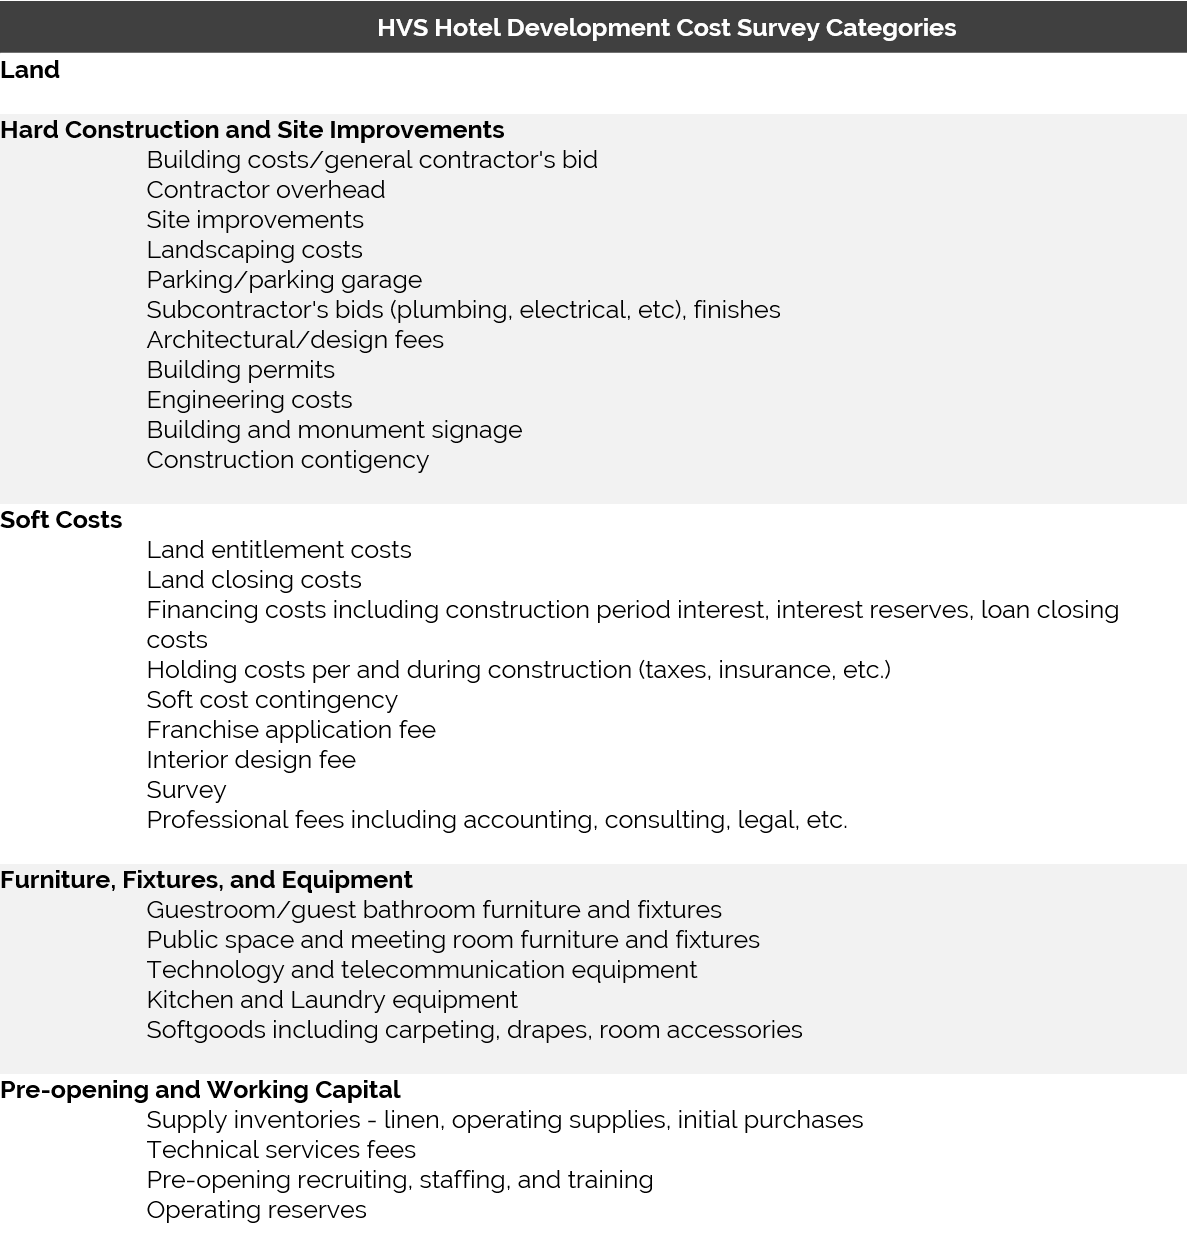
Source: HVS
The categories are not meant to be all-encompassing but do reflect the typical items in a development budget. In construction accounting, development budgets are generally presented in far greater detail than for general investment analysis.
Data Collection and Sample Size
In 2016, HVS collected more actual hotel construction budgets than ever before, spanning 42 states. While not every construction budget was captured (due to a variety of reasons, including incomplete data, skewed data, or development attributes), the construction budgets sampled span the United States. Furthermore, construction costs vary greatly in different parts of the country. In this sample, the highest construction costs per key were for projects in New York City and California. Other urban CBD markets, such as Chicago, Atlanta, and Dallas, reflected high costs, as well. Conversely, the highway adjacent, rural, and mid-America suburban markets set the low data points.
We selected 275 complete and reliable budgets that form the basis for this year’s survey. The budgets included projects that reflected both ground-up development and the redevelopment of existing buildings. Approximately 17% of the total budgets were projects where all or a portion of the building was existing. However, when comparing the average cost of redevelopment projects and ground-up projects, the hotels related to redevelopment had a higher cost per key. Part of this cost premium is attributable to product type, with redevelopment products more likely to provide a higher level of service, including meeting space and food-and-beverage facilities. Furthermore, existing buildings are more likely to be redeveloped in urban cores, which have higher construction costs than suburban markets and are more likely to be subject to union construction labor. Redevelopment of historic buildings were also more likely to have tax incentives or development rebates, helping to incentivize the projects and offset some of the cost premium associated with these kinds of projects. In general, these projects fall in line with their ground-up counterparts in terms of total development cost per key when the product type and location are considered.
We also examined the lodging product tier (STR chain scale) breakdown of our data set against the national data from STR. According to STR, over 4,700 hotels are in the U.S. pipeline for opening over the next three years. Our sample is generally in line with the STR’s national figures for breakdown by chain scale (by number of total rooms). Our data are considered representative of the nation as a whole.
Per-Room Hotel Development Costs
As noted previously, we have changed our categories this year to include three more segments. In addition to the common segments, we have bifurcated extended-stay hotels into two categories, midscale and upscale, and we have added a lifestyle/soft-brand category. Lastly, we had a large sample of dual- or triple-branded hotels in our data set. The growing popularity of these dual- and triple-branded hotels warranted a separate category. Most of these dual-branded budgets included a limited-service hotel and a select-service hotel, and the limited-service property usually offered an extended-stay product. The averages and medians reflect a broad range of development projects across the U.S., including projects in areas with low barriers to entry and in high-priced urban and resort destinations.
Exhibit 4: 2016/17 Hotel Development Cost-Per-Room Amounts
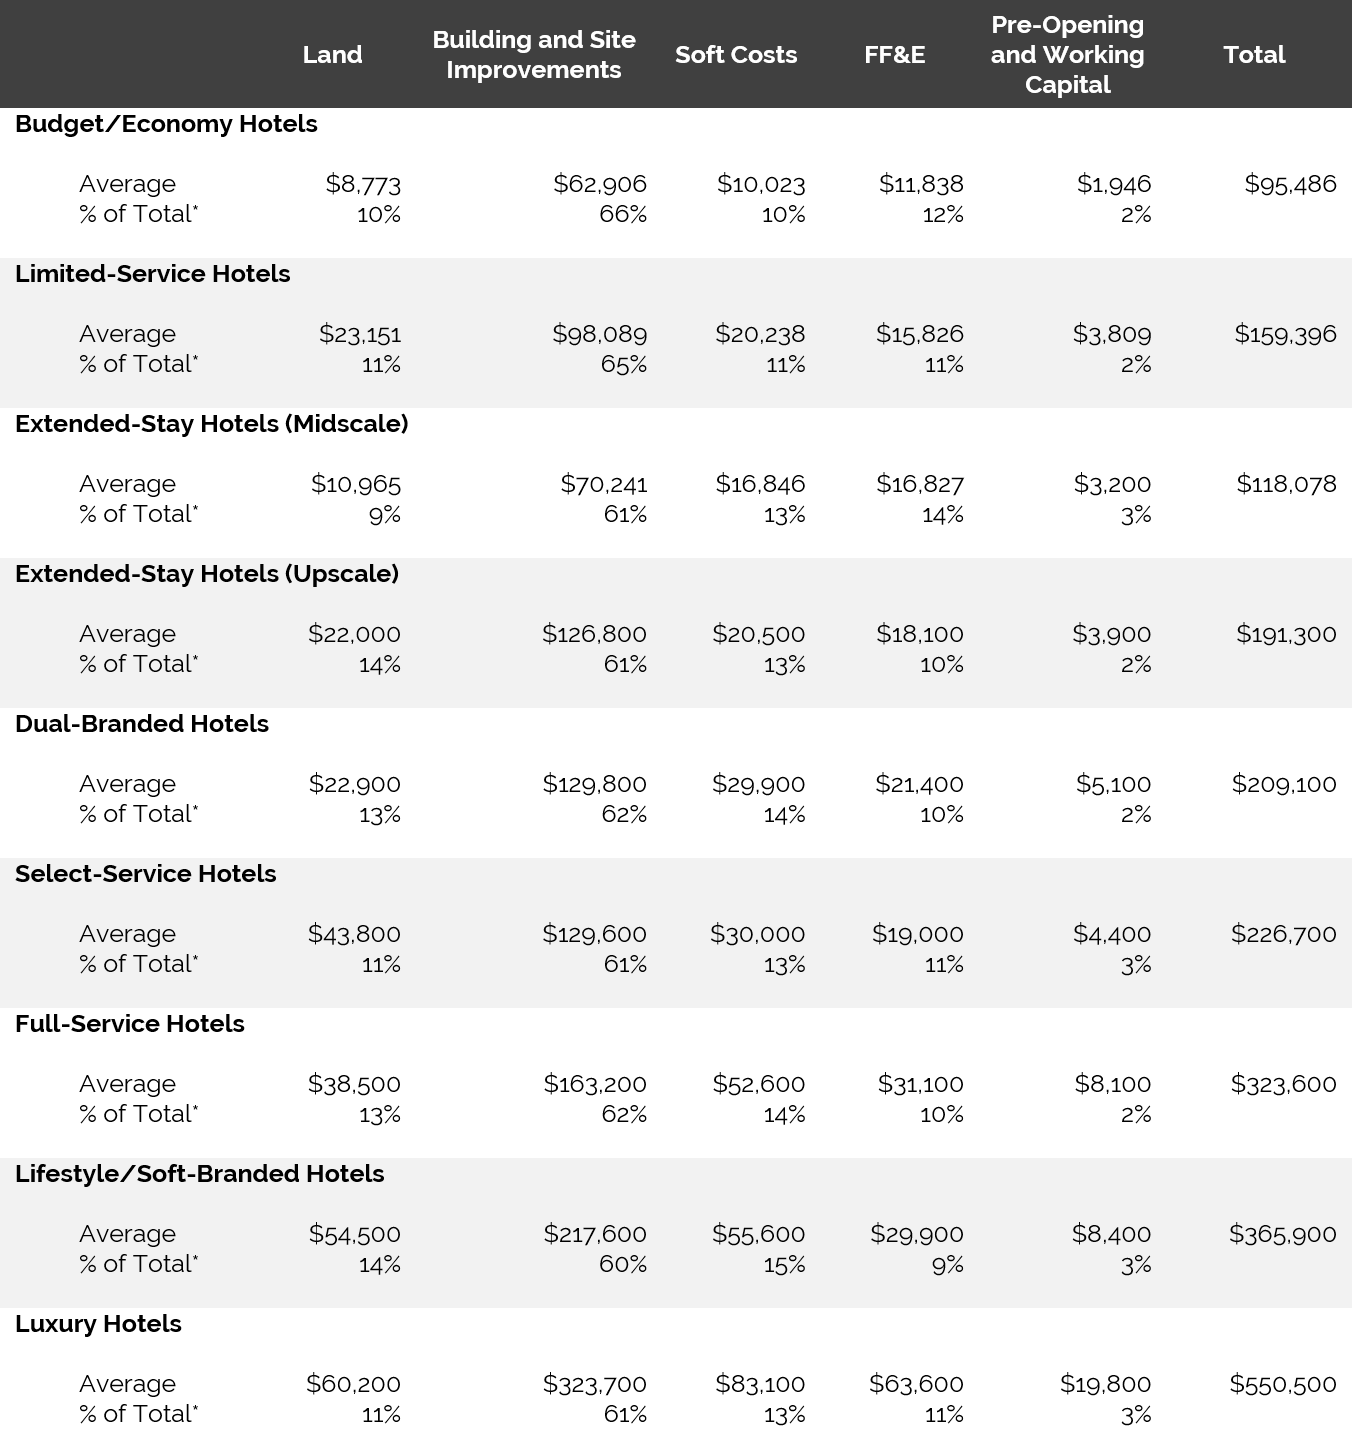
Source: HVS
The data supported many of the trends that we are seeing across the country. The increasing development of both midscale and upscale extended-stay products afforded us adequate data to provide the breakdown between these two product types. In addition, the increasing number of lifestyle/soft-branded projects under development enabled us to separately present cost data for this product type. Given the segmentation of the data, it is interesting to see the percentages of total across the nine categories. Whether one is building a budget/economy hotel or a luxury hotel, the percentages remain relatively consistent across all segments.
It is important to note that the hotel parent companies generally provide cost estimates for each of their brands. From our experience, these estimates are generally low compared to the actual budgets and do not account for location attributes. Construction companies are one of the best sources for accurate hard costs and FF&E costs for hotel projects. It is advised that developers consult more than one source in their hotel development process.
Exhibit 5: Hotel Development Cost Survey Per-Room Range of Costs for 2016
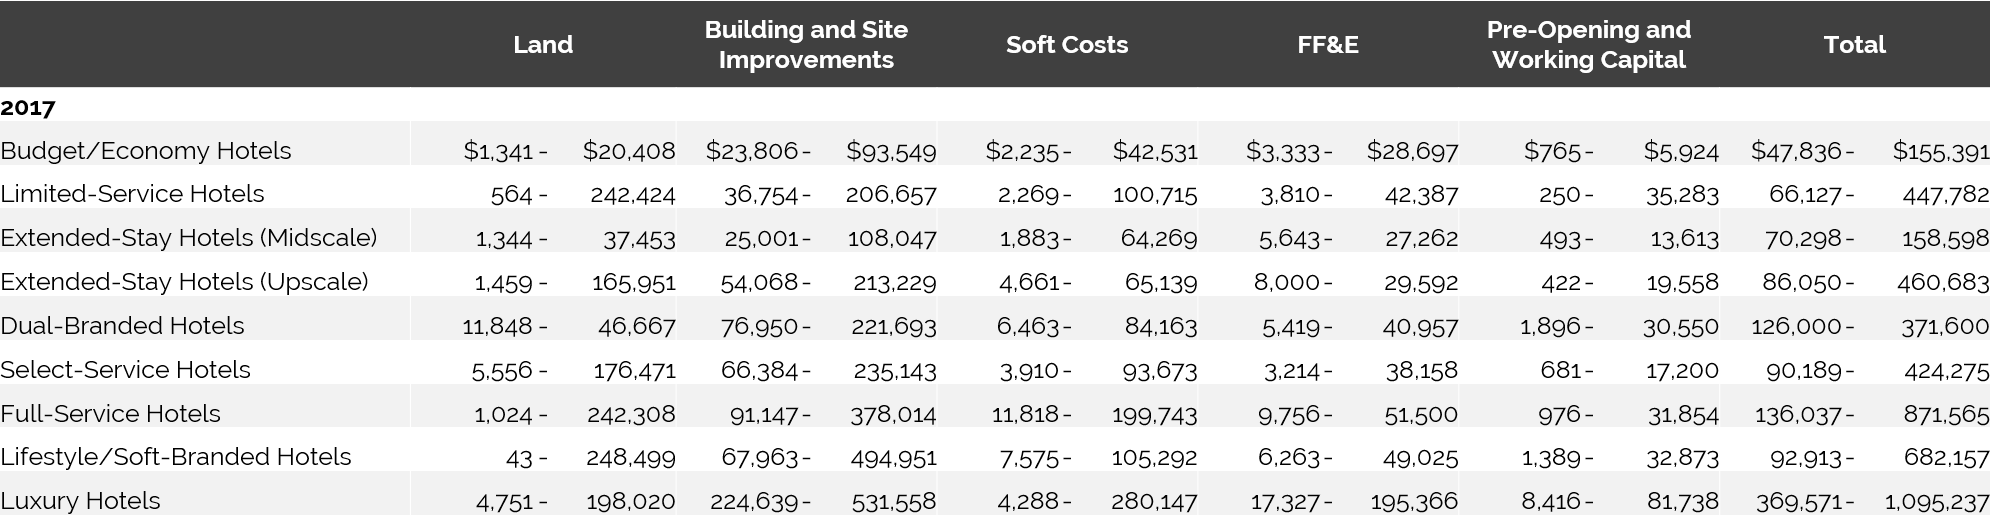
Source: HVS
The budgets analyzed in this survey are provided directly by the developers, owners, and lenders on both ground-up and conversion hotel projects.
Finally, we recommend that users of the HVS Hotel Development Cost Survey consider the per-room amount in the individual cost categories only as a general guide for that category. The totals for low and high ranges in each cost category do not add up to the low and high ranges of the sum of the categories. None of the data used in the survey included a project that was either all at the low range of costs or all at the high range of costs. A property that has a high land cost may have lower construction costs and higher soft costs. Hotels developed in high-cost markets, such as New York City, account for a small percentage of the projects, but typically have per-room component costs that set the upper end of the range. Alternatively, secondary and tertiary markets will generally account for projects on the lower end of the range. The total costs shown in the preceding table are from per-room budgets for hotel developments and are not a sum of the individual components.
All individual property information used by HVS for this cost survey was provided on a confidential basis and deemed reliable. Data from individual sources are not disclosed.