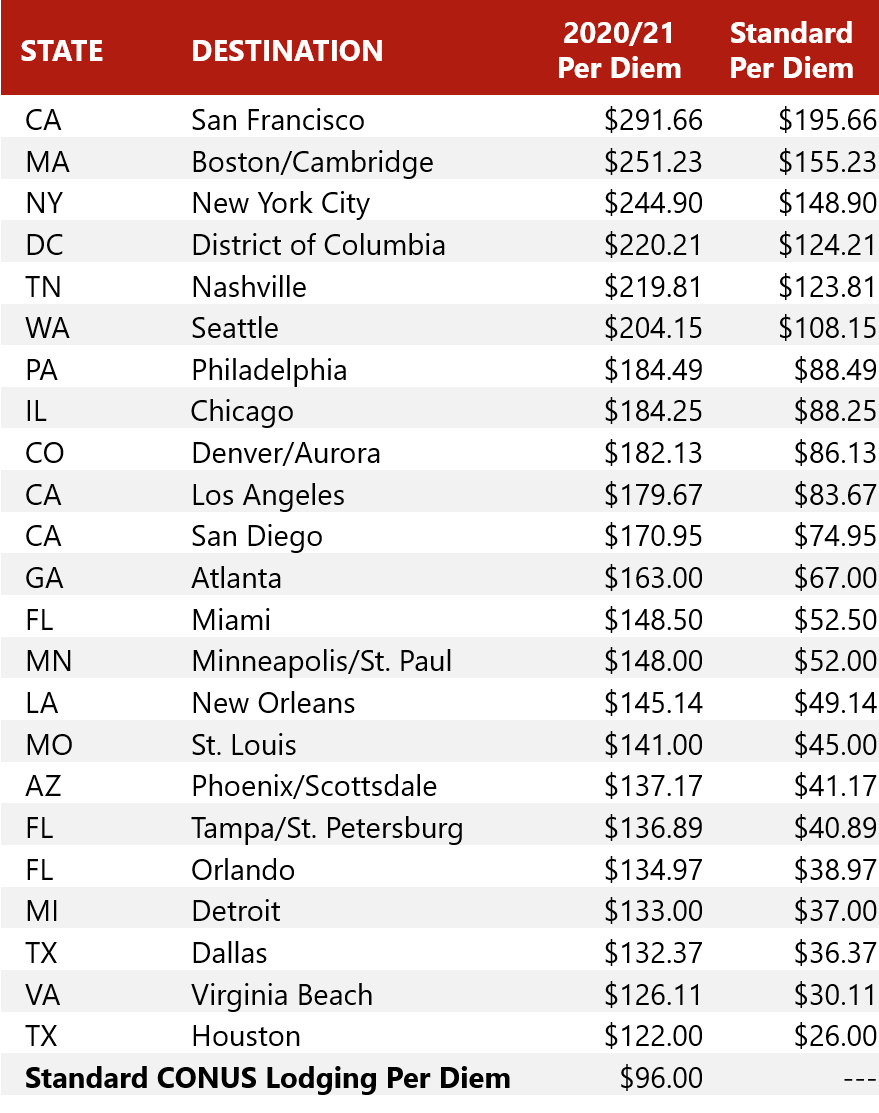
Government per-diem rates are set for a number of locations, many applying to multiple regions or localities in each state. A per-diem rate is made up of three components: a lodging allowance, meals allowance, and incidental expense allowance[1]; however, this article and the data presented below focus solely on the lodging allowance. The per-diem lodging rates, which provide a maximum amount that a federal traveler can reimburse, are based on the costs of mid-priced hotels, and are set annually by the U.S. General Services Administration (GSA). The following article examines the per-diem trends of the top lodging markets, as defined by STR. Hawaii is typically included in this list of top lodging markets; however, it has been excluded because the per diem rates are only set for the continental states.

What is a Per-Diem Rate and How is it Calculated?
Since 2005, the U.S. General Services Administration (GSA) has set the rates for the continental United States based on the average daily rate (ADR) data provided by STR, less 5%. There are also a number of criteria on which the GSA bases its calculations, including (1) hotels that comply with the Hotel & Motel Fire Safety Act of 1990, (2) properties within the mid-price range by STR, (3) ADR data from the prior twelve-month period, (4) Monday through Thursday weekday travel data, and (5) sustained seasonal rate periods. Given the criteria above, the GSA sets a standard continental United States (Standard CONUS) per-diem rate; however, it also establishes individual rates for Non-Standard Areas (NSAs) that tend to have per-diem rates higher than the standard.As one can imagine, the per-diem rates, as well as the areas represented, change annually as trends in local economies vary. For example, hotels in certain counties or cities may historically have been in the standard rate category, but perhaps their lodging ADRs have since increased, thus requiring that the GSA create a new NSA for that destination to allow a higher allowance to the federal traveler. The opposite also applies. For fiscal 2020/21, 319 NSAs were considered to have higher rates than the standard rate, which was reported to be $96 for the lodging allowance; in fiscal 2019/20, there were 322 NSAs.[2]
For the fiscal year 2020/21 per-diem study, the GSA used ADR data generated from March 2019 to February 2020, but the rates are not effective until October 1 of each year. The following data[3] reflect lodging average per-diem rates for the top U.S. lodging markets, taking any seasonality into account, presented in order from the destination with the highest difference above the Standard CONSUS.

As mentioned previously, per-diem rates can change annually. The following data illustrate the change in rate over the last five fiscal years. With the key below, the reader can see that market per-diem rates change relatively frequently, often tied to the overall health of the area’s lodging market performance. The markets below are presented in alphabetical order.
.png)

0 Comments
Success
It will be displayed once approved by an administrator.
Thank you.
Error